- Definition, Uses And Benefits
- Overview Of Network Topologies
- Overview Of Network Types
- Protocols And Standards
- Osi Reference Model
- Tcp/Ip Model
- Comparison Of Osi And Tcp/Ip
- Connectionless And Connection Oriented Network Services
- Internet, Isp, Backbone Overview
- Client Server And Peer To Peer Network
- Assignemnt -Chapter 1
- Chapter 1 Slides-Bca
- Chapter 1 Slides-Bsccsit
- Definition And Function
- Overview Of Llc And Mac
- Framing
- Flow Control
- Channel Allocation Techniques
- Ethernet Standards
- Dll Protocol
- Hamming Code-(Error Detection And Correction)
- Asynchronous Transfer Mode(Atm)
- Ieee 802.11
- Error Detection And Correction
- Parity Check - Error Detection
- Checksum -Error Detection
- Crc- Cyclic Redundancy Code
- Data Link Layer - Slides
- Introduction And Function
- Ipv4 Addressing And Subnetting
- Classful Address And Classless Addressing
- Ipv6 Addressing And Features
- Ipv4 And Ipv6 Header Format
- Comparision Of Ipv4 And Ipv6
- Example Address: Unicast, Multicast And Broadcast
- Example Address: Unicast, Multicast And Broadcast
- Routing And Routing Table
- Types Of Routing (Static Vs Dynamic, Unicast Vs Multicast,Link State Vs Distance Vector, Interior Vs Exterior)
- Routing Algorithm
- Routing Protocols
- Ipv4 To Ipv6 Transition Mechanism
- Icmp And Icmpv6
- Nat
- Network Traffic Analysis
- Firewall
- Access Control List
- Path Computation Algorithm
- Subnetting Numerical
- Lab 5:Basic Router Configuration
- Static Routing
- Dynamic Routing
- Creation Of Vlan And Trunking
- Creating A Lan And Connectivity Test In Lan
- Lab 3: Basic Network Command
- Implement Firewall Using Packet Tracer
- Basic Firewall Implementation
- Dns And Web Server Configuration
- Ftp
- Acl(Access Control List)
- Ethernet Cabling- Straight And Crossover
- Lab 1: Prepare A Hardware And Software Specification For Basic Computer System
- Lab 3: Determine Appropriate Placement Of Networking Device On A Network
MRTG
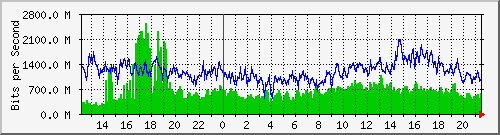
• The Multi Router Traffic Grapher (MRTG) is free software for monitoring and measuring the traffic load on network links. It allows the user to see traffic load on a network over time in graphical form.
• It was originally developed by Tobias Oetiker and Dave Rand to monitor router traffic, but has developed into a tool that can create graphs and statistics for almost anything.
• MRTG is written in Perl and can run on Windows, Linux, Unix, Mac OS and NetWare.
How it works
SNMP:
MRTG uses the Simple N etwork Man agement P rotocol (SNMP) to send requests with two object identifiers (OIDs) to a device.
The device, which must be SNMP-enabled, will have a management information base (MIB) to look up the OIDs specified.
After collecting the information it will send back the raw data encapsulated in an SNMP protocol.
MRTG records this data in a log on the client along with previously recorded data for the device.
The software then creates an HTML document from the logs, containing a list of graphs detailing traffic for the selected devices in the server.
Script output
Alternatively, MRTG can be configured to run a script or command, and parse its output for counter
values.
The MRTG website contains a large library of external scripts to enable monitoring of SQL database statistics, firewall rules, CPU fan RPMs, or virtually any integer-value data.
Features
o Measures two values (I for Input, O for Output) per target.
o Gets its data via an SNMP agent, or through the output of a command line.
o Typically collects data every five minutes (it can be configured to collect data less frequently).
o Creates an HTML page per target that features four graphs (GIF or PNG images).
o Results are plotted vs time into day, week, month and year graphs, with the I plotted as a full green area,
and the O as a blue line.
o Automatically scales the Y axis of the graphs to show the most detail.
o Adds calculated Max, Average and Current values for both I and O to the target's HTML page.
o Can also send warning emails if targets have values above a certain threshold.
PRTG:
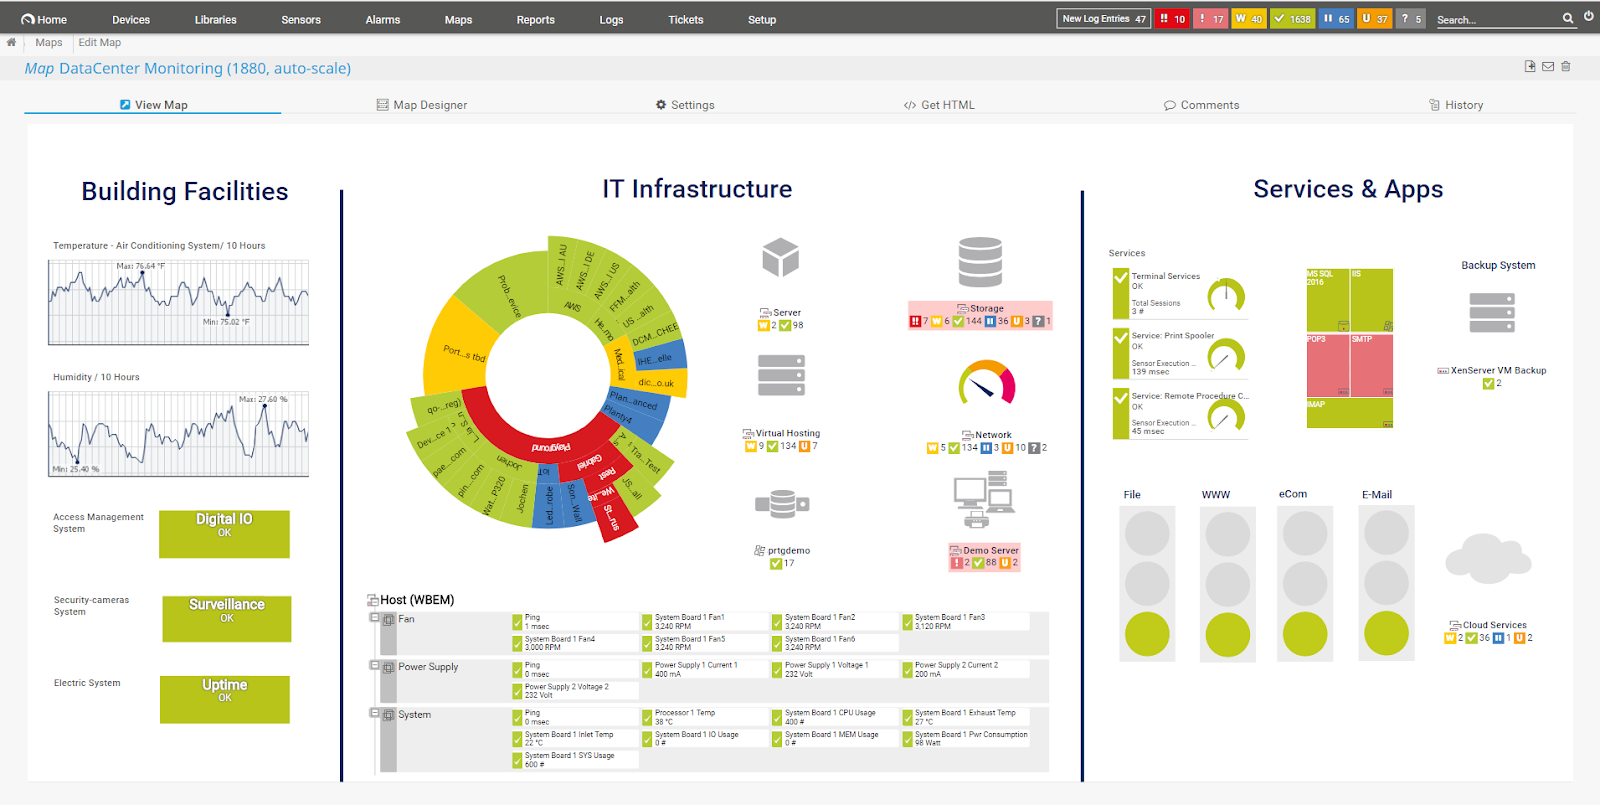
PRTG Network Monitor (Paessler Router Traffic Grapher until version 7) is an agentless network monitoring software from Paessler AG. It can monitor and classify system conditions like bandwidth usage or uptime and collect statistics from miscellaneous hosts as switches, routers, servers and other devices and applications.
1. Specifications
o PRTG Network Monitor has an auto-discovery mode that scans predefined areas of an enterprise network and creates a device list from this data.
o In the next step, further information on the detected devices can be retrieved using various communication protocols.
o Typical protocols are Ping, SNMP, WMI, NetFlow, jFlow, sFlow, but also communication via DICOM or the RESTful API is possible.
o The tool is only available for Windows systems. In addition, Paessler AG offers the cloud-based monitoring solution "PRTG hosted by Paessler"
1.1 Sensors
The software is based on sensors that are configured for a specific purpose. For example, there are HTTP, SMTP/POP3 (e-mail) application sensors and hardware-specific sensors for switches, routers and servers. PRTG Network Monitor has over 200 different predefined sensors that retrieve statistics from the monitored instances, e.g. response times, processor, memory,
database information, temperature or system status.
1.2 Web interface and desktop client
The software can be operated completely via a AJAX-based web interface. The web interface is suitable for both real-time troubleshooting and data exchange with non-technical staff via maps (dashboards) and user-defined reports. An additional administration interface in the form of a desktop application for Windows and macOS is available.
1.3 Notifications and reports
In addition to the usual communication channels such as Email and SMS, notification is also provided via push notification on smartphones using an app for iOS or Android. PRTG also offers customizable reports.
1.4 Pricing
PRTG Network Monitor's licensing is based on sensors. Most devices require between five and ten sensors to be fully monitored. A version with 100 integrated sensors is available free of charge.
Packet Analyzer:
• A packet analyzer (also known as a packet s niffer) is a computer program or piece of computer hardware (such as a packet capture appliance) that can intercept and log traffic that passes over a digital network or part of a network.
• Packet capture is the process of intercepting and logging traffic.
• A packet analyzer used for intercepting traffic on wireless networks is known as a wireless analyzer or WiFi analyzer.
• A packet analyzer can also be referred to as a network analyzer or protocol analyzer though these terms also have other meanings.
Capabilities
o On wired shared medias networks, such as Ethernet, Token Ring, and FDDI networks, depending on the network structure (hub or switch), it may be possible to capture all traffic on the network from a single machine on the network.
o On modern networks, traffic can be captured using a network switch with a so-called monitoring port that mirrors all packets that pass through designated ports of the switch.
o On wireless LANs, traffic can be captured on one channel at a time, or by using multiple adapters, on several channels simultaneously.
o When traffic is captured, either the entire contents of packets are recorded, or just the headers are recorded. Recording just headers reduces storage requirements, and avoids some legal issues, yet often provides sufficient information to diagnose problems.
o Captured information is decoded from raw digital form into a human-readable format that lets users easily review exchanged information. Protocol analyzers vary in their abilities to display and analyze data.
o Some protocol analyzers can also generate traffic and thus act as the reference device.
o Protocol analyzers can also be hardware-based, either in probe format or, as is increasingly common, combined with a disk array. These devices record packets (or a slice of the packet) to a disk array.
Uses:
Packet sniffers can:
o Analyze network problems
o Detect network misuse by internal and external users
o Monitor WAN bandwidth utilization
o Gather and report network statistics
Notable packet analyzers
o Wireshark formerly known as Ethereal)
o ngrep, Network Grep
o Fiddler
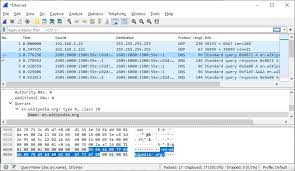
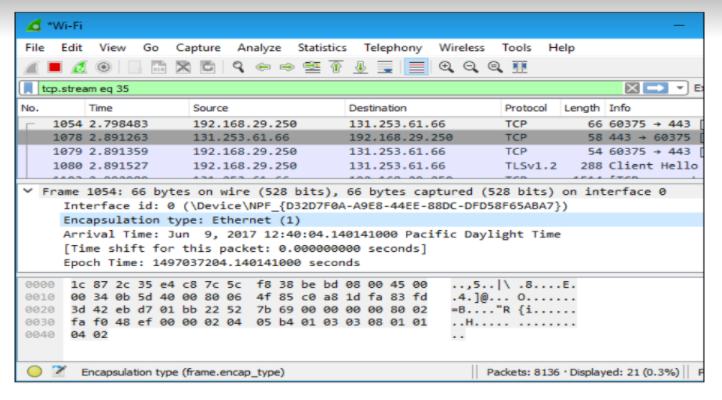
Wireshark
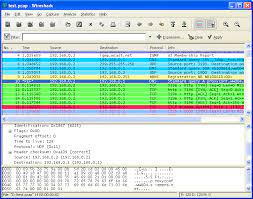
Wireshark, a network analysis tool formerly known as Ethereal, captures packets in real time and display them in human-readable format.
• Wireshark includes filters, color coding, and other features that let you dig deep into network traffic and inspect individual packets.
• Wireshark is a free and open-source packet analyzer. It is used for network troubleshooting, analysis, software and communications protocol development, and education.
Features
Wireshark is a d ata c apturing p rogram t hat " understands" t he structure ( encapsulation) of d ifferent networking protocols.
• Data can be captured "from the wire" from a live network connection or read from a file of already-captured packets.
• Live data can be read from different types of networks, including Ethernet, IEEE 802.11, PPP, and loopback.
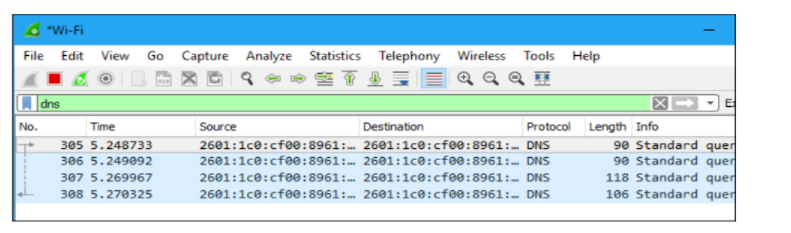
• Data display can be refined using a display filter.
• Wireless connections can also be filtered as long as they traverse the monitored Ethernet.
• Various settings, timers, and filters can be set to provide the facility of filtering the output of the captured traffic
Color Coding
It probably can see packets highlighted in a variety of different colors. Wireshark uses colors to help you identify the types of traffic at a glance. By default, light purple is TCP traffic, light blue is UDP traffic, and black identifies packets with errors—for example, they could have been delivered out of order.
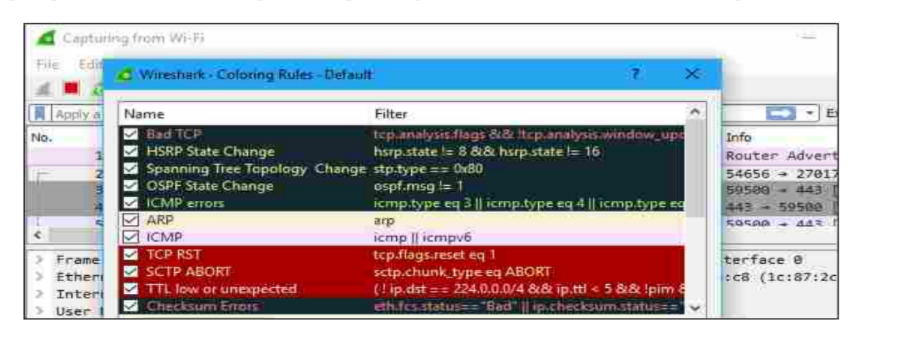
If you’re trying to inspect something specific, such as the traffic a program sends when phoning home,it helps to close down all other applications using the network so you can narrow down the traffic. Still, you’ll likely have a large amount of packets to sift through. That’s where Wireshark’s filters come in.
Inspecting Packets