- Control Of Information System
- Audit Of Information System
- Security Of Information System
- Consumer Layered Security Strategy
- Enterprise Layered Security Strategy
- Extended Validation And Ssl Certificate
- Remote Access Authentication
- Content Control And Policy Based Encryption
- Example Of Security In Ecommerce Transaction
- Enterprise Management Systems (Ems)
- 2.1. Enterprise Software (Erp/Crm/Scm)
- 2.2. Information Management And Technology Of Enterprise Software
- 2.3. Role Of Is And It In Enterprise Management
- 2.4. Enterprise Engineering, Electronic Organism, Loose Integration Vs Full Integration, Process Alignment, Framework To Manage Integrated Change, Future Trends
INFORMATION SYSTEM CASE STUDY
PREPARE A BALANCED SCORECARD FOR ANY ORGANIZATION.
BALANCED SCORECARD ON INTEL
Intel software and technology are known to be quality products. Their processors are widely used in personal and corporate-level computing systems. Robert Noyce and Gordon Moore, two Silicon Valley innovators, founded Intel in July of 1968 to manufacture semiconductor chips intel started in Mountain View, CA, 1968 as a semiconductor chip manufacturer. By 1971, the company was able to make commercially available products.
Since its founding as a microprocessor manufacturer, the company has expanded its operations to the present-day Santa Clara headquarters.
The founders decided to name the fledgling microprocessor company Intel instead of the original name, N.M. Electronics, to make things more interesting. Noyce and Moore purchased the rights to the name Intelco from a hotel chain that was already using the name. Although the type of personal computer that the general public would use was still years away, the company saw substantial growth by its third year. During the 1990s, Intel created motherboards that included chips and graphics cards. Between 2005 and 2020, Apple used Intel processors.
History of Intel
1968-1989: Early semiconductor chip development
Noyes and Moore started their company to create more affordable, practical semiconductor prod ucts. With the help of a venture capitalist, the new company raised 2.5 million dollars over two days. In 1969, the company invented the first microprocessor in the world. One of the company’s most significant achievements was producing processors for a Japanese company, Busicom, that made desktop calculators. Although this company went out of business by 1974, Intel bought the rights to their processor technology back, which helped make further production possible.
1990-2000: Intel becomes a household name
The personal computer market was small until the late 1980s when more households started to buy computers for gaming and other purposes. A processor designed during this time, the 386, helped provide momentum for the company’s “Intel Inside” campaign. An increasing number of computers started using Intel processors. Intel partnered with many computer manufacturers during the 1990s, permitting the companies to use “Intel Inside” in their advertising. These joint advertising campaigns were among some of the most successful of their kind. By the later part of the decade, Intel ran its commercials with the help of major special-effects companies like Industrial Light Magic.
2000-present: intel dominates the processor market and further expands
During the 1990s, the company expanded into creating motherboards that included chips and graph ics cards. Most personal computers made by companies besides Apple used Intel, but between 2005 and 2020, Apple used Intel processors as well.
The iCore line debuted in 2006, providing a framework for gaming and other high-performance computers. Between 2008 and 2021, the company produced hard drives, with this line later acquired by SK Hynix. This company has also been involved in the self-driving car technology market since 2017.
The important inventions of Intel
1. Intel 4004 The Intel 4004 was the first microprocessor that the company created. This model helped create a path for future microprocessor models that would provide the backbone of modern computing. Later incarnations of this chip would be used in other consumer electronics.
2. Pentium The Pentium processor, dating back to the mid-1990s, was used in most computers manufactured for home use. As more computer users started going to laptop use, this processor remained popular. More recent versions, such as current GPU options, have built and improved on this technology.
Mission and Vision
The business at Intel is creating a better world. Its goal is to use Moore’s Law to make smart, connected devices accessible to everyone on Earth and to provide an example for how businesses should conduct themselves. They use a wide range of products and dynamic collaborations to power incredible experiences. The goal of their plan is more connectivity and improved performance, which is shared by the cloud and data center, the Internet of Things, memory, and FPGAs. Their international workforce, with over 107,000 members spread across 58 nations, is a technological and engineering powerhouse that empowers solutions to the world’s most difficult issues while developing tomorrow’s technology.
Business Model
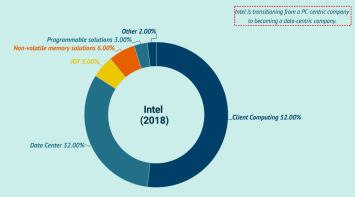
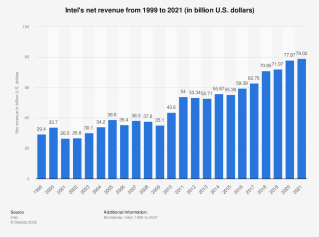
Revenue
SWOT Analysis Of Intel
Strengths:
1. Leading the technology market.
2. Brand Value.
3. Enormous Clientele.
4. Partners with Microsoft.
Weaknesses:
1. No service in developing countries.
2. Decrease in profit earned.
3. Over production of products.
4. No presence in the mobile industry.
Opportunities:
1. Reach diverse places for business.
2. Enter the smartphone business industry.
3. Increase demand for computers.
4. Increased usage of drones.
Threats:
1. Many Competitors.
2. Dependent on one product.
3. Chinese products.
4. Different needs and demands of customers.
Intel Acquisitions
Altera - 16.75 billion dollars - 2015
Altera manufactured field-programmable gate arrays. They are configurable smart chips. Of the 87 acquisitions that Intel has made as of 2022, Altera was the largest cost-wise.
Mobileye - 15.3 billion dollars - 2017
Mobileye was involved with self-driving car technology. This acquisition has helped give the com pany a place in emerging automotive technology. One of the lasting effects of this acquisition has been better, more efficient technology for cars.
Intel’s Top Competitors
1. NVIDIA Corporation
2. AMD
3. Samsung
4. IBM
5. Qualcomm
Balanced Scorecard
A balanced scorecard is a performance metric used to identify, improve, and control a business’s various functions and resulting outcomes. The concept of BSCs was first introduced in 1992 by David Norton and Robert Kaplan, who took previous metric performance measures and adapted them to include non-financial information. Data collection is crucial to providing quantitative re sults as managers and executives gather and interpret the information. BSCs allow companies to pool information in a single report, to provide information into service and quality in addition to financial performance, and to help improve efficiencies. Company personnel use this information to make better decisions for the future of their organizations.
The balanced scorecard model links performance measures in an organization by isolating four separate areas that need to be analyzed. These four perspectives, also known as legs are:
2.1 Learning and Growth Perspectives
A company’s ability to innovate, improve, and learn ties directly to the company’s value. That is, only through the ability to launch new products, create more value for customers, and improve operating efficiencies continually can a company penetrate new markets and increase revenues and margins—in short, grow and thereby increase shareholder value. This information is ana lyzed through the investigation of training and knowledge resources. This first leg handles how well information is captured and how effectively employees use that information to convert it to a competitive advantage within the industry.
2.2 Internal Business Perspective
Managers need to focus on those critical internal operations that enable them to satisfy customer needs. The second part of the balanced scorecard gives managers that internal perspective. The internal measures for the balanced scorecard should stem from the business processes that have the greatest impact on customer satisfaction—factors that affect cycle time, quality, employee skills, and productivity. These processes are evaluated by investigating how well products are manufac tured. Operational management is analyzed to track any gaps, delays, bottlenecks, shortages, or waste. Companies should decide what processes and competencies they must excel at and specify measures for each.
2.3 Financial Perspective
Financial perspective means the stakeholders’ view of the organization. Financial data such as sales, expenditures, and income are used to understand financial performance. These financial metrics may include dollar amounts, financial ratios, budget variances, or income targets.
Many have criticized financial measures because of their well-documented inadequacies, their backward-looking focus, and their inability to reflect contemporary value-creating actions. Some critics argue that companies should stop navigating by financial measures. They argue that by making fundamental improvements in their operations, the financial numbers will improve on their own. However, it is incorrect to say that financial measures are not necessary as a well-designed financial control system can actually enhance rather than inhibit an organization’s total quality management program.
2.4 Customer Perspective
The balanced scorecard demands that managers translate their general mission statement on cus tomer service into specific measures that reflect the factors that really matter to customers.
Customers’ concerns tend to fall into four categories: time, quality, performance and service, and cost. Lead time measures the time required for the company to meet its customers’ needs. For existing products, lead time is the time taken to actually deliver product or service to the customer from the order time. For new products, lead time represents the time to market the product. Qual ity measures the defect level of incoming products as perceived and measured by the customer. The combination of performance and service measures how the company’s products or services contribute to creating value for its customers.
Benefits of Balanced Scorecard
Using a balanced scorecard helps in representing the fundamental change in the underlying assump tions about different performance measures. Unlike the traditional performance measures which heavily rely on control and on the financial measures, the balanced scorecard puts strategy and vision, not control, at the center.
It is designed in a way to pull people towards the main vision of the organization. Applying a balanced scorecard has several advantages to it. It helps in efficient use of resources through better strategic planning and proper communication of organizational strategy. The Balanced Scorecard help organizations to align their projects to different objectives.
The benefits of using a balanced scorecard are listed below:
• Better strategic Planning
• Improved Strategy Communication and Execution
• Better Alignment of Projects Initiatives
• Insightful Management Information
• Improved Performance Rating
• Better Organizational Alignment
• Better Process Alignment
The Balanced scorecard combines the financial, customer, internal process and innovation, and or ganizational learning perspectives and helps managers in understanding, at different levels, many interrelationships, which enables them improve their decision-making and problem-solving abili ties transcending the traditional notions about functional barriers. The balanced scorecard approach to performance measurement is consistent with the initiatives under way in many companies: cross functional integration, customer-supplier partnerships, global scale, continuous improvement, and team rather than individual accountability.
Intel Balanced Scorecard
Introduction
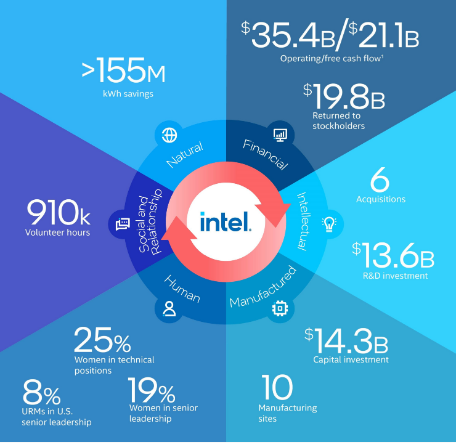
Approximately 50% of fortune 1000 companies in North America and 40% in Europe use a version of BSC according to a recent study by Brain & Co. Intel doesn’t explicitly use balanced scorecard for measuring its performance. However, in its annual reports, it includes 6 forms of capital: fi nancial, intellectual, manufactured, human, social and relationship, natural each considered with numerous indicators to determining the success of their capital deployment in creating value. Sim ilarly, it provides other forms of reports such as IT performance report, corporate responsibility report, etc from which we can view various perspectives of its performance and create a consoli dated balanced scorecard.
Intel’s defines its purpose as “To create world-changing technology that improves the lives of ev ery person on Earth”. For this it postulated many goals both for short and long term. Intel also announced its decade long goal under its corporate responsibility to be completed by 2030 in May 2020 as “RISE” strategy and goals. It aims to create a more responsible, inclusive, and sustainable world, enabled through technology and the expertise and passion of their employees.
Intel measures its performance across 6 different categories which it also refers to its capital. The strategies across each are:
• Financial: Leverage financial capital to invest and drive strategy, supplement and strengthen our capabilities through acquisitions, and provide returns to stockholders.
• Intellectual: Invest significantly in R&D and IP to enable delivering a predictable cadence of leadership products that move, store, and process data at scale, and extend reach to accelerate growth.
• Manufacturing: Invest timely and at a level sufficient to meet customer demand for current technologies and prepare for future technologies as we evolve.
• Human: Continue to build a diverse, inclusive, and safe work environment to attract, develop, and retain the talent needed to remain at the forefront of innovation.
• Social & relationship: Build trusted relationships for both Intel and stakeholders, including employees, suppliers, customers, local communities, and governments.
• Natural: Continually strive to reduce environmental footprint through efficient and respon sible use of natural resources and materials used to create our products.
Environmental aspects are also considered to be a part of their business value by many organizations today. Intel also considers it seriously and mentions its achievement annually under its natural capital. This environmental performance can be integrated into the traditional balanced scorecard in various ways as discussed by Zwyalif (2017). These approaches are:
1. Integrating environmental aspects in the four BSC perspectives: environmental aspects can be subsumed under the four existing BSC perspectives through strategic elements, objectives and indicators. Using this approach, environmental aspects become an integral part of con ventional BSC and Integrated within the chain of cause and effect. These aspects should be integrated in the market system. Therefore, this approach is especially relevant for strategic environmental aspects that are already integrated in this system.
2. Adding a fifth perspective to the balanced scorecard: Kaplan and Norton pointed out that a company-specific creation of a BSC may involve adding or renaming a perspective. As noted earlier, many environmental aspects are not integrated into a market system as the standard BSC perspectives reflect only the market system. So, adding a fifth perspective (environmental perspective) to the BSC is justified when environmental aspects from outside the market system, consider strategic core aspects of the strategy of the organization.
3. Developing a separate environmental balanced scorecard: the third approach to including the environmental aspects in the BSC is based on the creation of a separate EBSC in order to be used by the environmental department internally. The design and implementation of a special EBSC have to be connected with a standard BSC. In other words, EBSC is not independent from conventional BSC. With proper linkage with BSC an organization could achieve good results relating environmental management system. Moreover, illustrating the environmental strategy across all four perspectives could help to improve this system. A separate EBSC is useful as it illustrates links between certain types of environmental performance and the strategic and financial objectives of an organization.
For this study, we added a fifth perspective under the balanced scorecard along with the four tradi tional perspectives.
10
Financial Perspective
|
Goals |
Measures |
|
Create long term value |
Revenue |
|
Sustain |
Operating Income Cash flow |
|
Provide returns to our stockholders |
Diluted EPS |
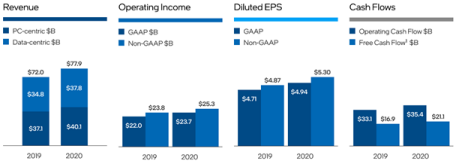
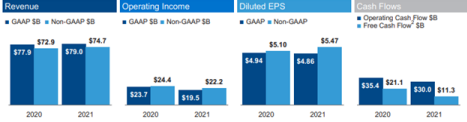
Intel releases its financial standing in both GAAP and non-GAAP financial measures. The gen erally accepted accounting principles (GAAP) are the standardized set of principles that public companies in the U.S. must follow. Non-GAAP measures usually adjust earnings to exclude non operational costs, such as those associated with acquisitions. Intel presented its financial goals for three years (2019-2021) in terms of non-GAAP measure. Free cash flow decreased from 2020 to 2021 due to lower operating cash flow and higher capital expenditures. Lower operating cash flow
12
was due to higher operating expenses on increased R&D investment.
Internal Business Perspective
|
Goals |
Measures |
|
Diversity and Inclusion |
Women in technical position, senior leadership URM in US senior leadership |
|
Social and employee relationship |
Volunteer hours Undesired turnover rate Employee satisfaction |
|
Improve manufacturing |
Number of manufacturing sites Volumes produced |
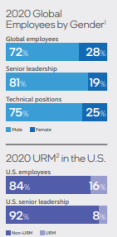
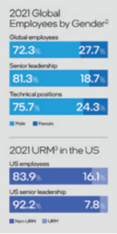
Intel has focused a lot on inclusion of diverse groups in its company and also across its supply chains. It also included inclusive world in its RISE strategy and goals under which it aims to have 40% women in technical roles by 2030. In 2020 25% women were in technical leadership and 19% in senior leadership. Similarly 8% under represented minority (URM) were in senior leadership positions in the US. These percentage decreased slightly in 2021 so, Intel might want to improve its effort for inclusion. Intel also measured its social relationship by volunteer hours from its retired employees and aims to achieve a total of 10 million hours till 2030 from 2020 and with 1.7 million volunteer hours till 2021 it may need a little more effort to reach its goal. Undesired turnover rate (includes employees who leave voluntarily) was particularly high in 2021 which may be due to tightening labor market and increased competition to attract and retain talent following rise in global demand for semiconductors.
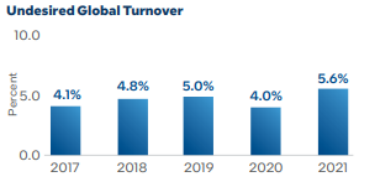
Figure 3.4: Turnover rate across years
Innovation and learning perspective
|
Goals |
Measures |
|
Product Development |
R&D spending |
|
New solutions |
Business Value created |
|
Innovation |
Patents granted Invention disclosure form submission |
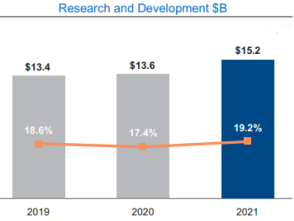
Figure 3.7: Patents granted 2020
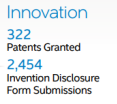
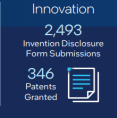
Figure 3.8: Patents granted 2021 Figure 3.9: Patents granted 2020
R&D investments enables Intel to deliver on accelerated process technology roadmap, introduce leading products, and develop new businesses and capabilities. Its R&D investments are in increas ing trend and thus is more likely to create values in future. This can be assessed with other business
measures. New solutions such as Artificial Intelligence, Augmented reality can create value. By embedding and enabling Intel’s use of AI across critical business processes, they delivered more than USD 1.56 billion in business value in 2020. Effort to protect R&D efforts through IP rights can also be taken as a measure for increasing innovation in the company.
Customer Perspective
|
Goals |
Measures |
|
Serve more customers |
Market share |
|
Customer satisfaction |
Net promoter score |
|
Customer retention |
Revenue from largest customers |
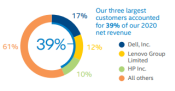
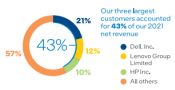
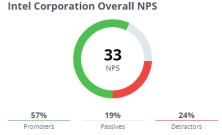
Figure 3.12: Intel NPS score 2022
Intel has notably held its position in microprocessor industry and x86 desktops in particular (against its competitor AMD) with market share of 78.3% in 2020 which however decreased to 75.4% in 2021. It seems to do well with its long standing customer as its revenue from three largest customers (Dell, Lenovo and HP) increased from 39% (2020) to 43% (2021). Net promoter score (percentage of promoter - percentage of detractor) might be useful in evaluating general customer satisfaction. It measures how likely its customer is to suggest its product to others. Intel’s promoters are those who respond with a score of 9 to 10, and they are likely to create most value, such as buying more, remaining customers for longer, and making more positive referrals to other potential customers. Detractors, responding with a score of 0 to 6 are believed to be less likely to exhibit the value creating behaviors. Responses of 7 and 8 are labeled passives.
Environmental Perspective
|
Goals |
Measures |
|
Savings |
Energy saving |
|
Greenhouse reduction |
Emission reduction |
|
Use of Renewable resource |
Percentage of energy from renewable source |
|
Water stewardship |
Water use |
Intel is a multinational manufacturing company with huge manufacturing sites. Improved methods can create energy which can thus help lower its impact on environment as well as its own econ omy. In 2020 intel reported 155 million kwh savings in energy equivalent to $500 million in cost reductions. It aims to save 4 billion kwh by 2030 under its RISE goal. Similarly, to reduce its footprint it aims to use 100% renewable resources by 2030 compared to 81% in 2021 and 75% in 2020. It achieved its goal in greenhouse emission reduction by reducing greenhouse emission by 39% from 2010 to 2020. It aims to further reduce greenhouse emission by 10% by 2030. Intel uses ultra-refined water obtained from freshwater sources to clean silicon wafers during manufacturing. In order to reduce its impact, it aims to gain net positive water use (i.e. total water treated and re turned to environment + water restored through watershed projects > water coming from freshwater sources) and 60 billion gallons of water savings till 2030. It conserved a total of 5 billion gallons in 2020 and 15.4 billion gallons till 2021. Similarly, it restored 1 billion gallons in 2020 and 3.5 billion gallons till 2021. So, Intel seems to be well on its goal to reduce environmental impact and reduce its footprint.
References
1. Al-Zwyalif I.M. “Using a Balanced Scorecard Approach to Measure Environmental Perfor mance: A Proposed Model”, International Journal of Economics and Finance, Vol 9 No.8 Pg.118-126
2. Norton D. and Kaplan R. ”The Balanced Scorecard—Measures that Drive Performance”. Harvard Business Review. Jan-Feb, 1992
3. Intel Annual Report 2020
4. Intel IT Performance Report (2020-2021)
5. Intel Corporate Responsibility Report (2020-2021)
6. Intel Annual Report 2021
7. Intel IT Performance Report (2021 - 2022)
8. Intel Corporate Responsibility Report (2021 - 2022)
9. Saphira Z, ”Enable efficient quality gates of the AI model lifecycle by moving toward au tonomous quality in AI model productization”, IT@Intel: Autonomous Quality in AI Model Productization: A Journey
AUTHOR
NIKESH D.C. (PUL075BCT052)
RAVI PANDEY (PUL075BCT065)
ROHAN CHHETRY (PUL075BCT066)
YUKTA BANSAL (PUL075BCT096)