SUBMITTED BY:
DIPESH REGMI (077BCT027)
DIVYA KARKI (077BCT028)
KHAGENDRA KARKI(077BCT036)
KRIPESH NIHURE (077BCT037)
MUKTI SUBEDI (077BCT048)
1. Introduction
Railway Reservation System
The Railway Reservation System is a software application designed to facilitate the booking and management of train tickets for passengers. It provides functionalities to check seat availability, book tickets, cancel reservations, and calculate fares. This report outlines the system requirements and design considerations for implementing such a system.
The Railway Reservation System is a critical component of the transportation infrastructure, facilitating the booking and management of train tickets for passengers. In the modern era, where travel by train remains a popular and essential mode of transportation, an efficient and reliable reservation system is paramount to ensure seamless travel experiences for passengers while optimizing operational efficiency for railway authorities. This Object-Oriented Analysis and Design (OOAD) report aims to provide a comprehensive analysis and design overview of the Railway Reservation System using Unified Modeling Language (UML) diagrams.
Railway reservation systems typically encompass a wide range of functionalities, including ticket booking, seat allocation, cancellations, fare calculation, schedule management, and passenger information management. Such systems must cater to diverse user roles, including passengers, administrators, and ticketing agents, each with specific responsibilities and access privileges. Additionally, they must handle complex interactions between various system components, such as trains, stations, routes, and payment gateways, while ensuring data integrity, security, and scalability.
In this report, we will employ UML diagrams to model and analyze the static and dynamic aspects of the Railway Reservation System. Class diagrams will delineate the system's static structure, identifying key entities, their attributes, and relationships. Use case diagrams will provide insights into the system's functionalities from the users' perspective, illustrating the various actions users can perform and the interactions with the system. Sequence diagrams will depict the dynamic behavior of the system, showcasing the sequence of interactions between objects during runtime. State machine diagrams will capture the lifecycle and behavioral transitions of key entities within the system, while activity diagrams will illustrate the flow of activities and processes.
Through the application of UML diagrams, this report aims to offer a comprehensive understanding of the Railway Reservation System, from its conceptual design to its implementation and deployment. By leveraging OOAD principles and UML notation, stakeholders can gain valuable insights into the system's requirements, design considerations, and architectural decisions, laying the foundation for the development of a robust, efficient, and user-friendly railway reservation system.
1.2 UML Notation
In the railway reservation system project report, various UML diagrams are utilized to represent different aspects of the system. Here's a brief overview of the UML notation used:
1. Class Diagrams: Represented by rectangles with compartments for class name, attributes, and methods. Associations between classes are depicted using lines with arrows indicating the direction of the relationship.
2. Use Case Diagrams: Actors are represented as stick figures outside the system boundary, while use cases are depicted as ovals within the boundary. Relationships between actors and use cases are shown using solid lines.
3. Sequence Diagrams: Lifelines represent objects or components participating in interactions, depicted as vertical dashed lines. Messages exchanged between lifelines are shown as horizontal arrows.
4. State Machine Diagrams: States represent different conditions or modes of an object or system, depicted as rounded rectangles. Transitions between states are shown as arrows, triggered by events or conditions.
5. Activity Diagrams: Activities are represented as rounded rectangles, depicting specific actions or tasks. Control flows between activities are shown using arrows.
These notations provide a standardized and visual way to represent different aspects of the railway reservation system, aiding in requirements analysis, design, and communication among stakeholders.
1.3 Requirements
1.3.1 Functional Requirements
Seat Availability Inquiry: Users should be able to inquire about the availability of seats between any two stations and for any class.
Ticket Booking: Users should be able to book tickets by providing journey details and passenger information.
Ticket Cancellation: Users should be able to cancel their reservations within a specified time frame.
Fare Calculation: The system should calculate fares based on the class of travel and the distance between stations.
User Management: The system should support user registration, login, and profile management functionalities.
Admin Functionality: Admins should have the ability to manage trains, stations, seat capacities, and fares.
1.3.2 Non-functional Requirements
Performance: The system should be able to handle multiple concurrent user requests efficiently without significant degradation in performance.
Reliability: The system should be reliable, with minimal downtime and data consistency.
Security: The system should implement proper authentication and authorization mechanisms to ensure data privacy and prevent unauthorized access.
Scalability: The system should be scalable to accommodate future growth in terms of user base and system load.
Usability: The system should have a user-friendly interface that is intuitive and easy to navigate for both passengers and administrators.
These functional and non-functional requirements serve as the foundation for designing and implementing the Railway Reservation System, ensuring that it meets the needs of both passengers and railway administrators while maintaining high standards of performance, reliability, and security.
2. Use case diagram
Introduction to Use Case Diagrams in Object-Oriented Analysis and Design (OOAD) Report:
Use case diagrams are essential components of Object-Oriented Analysis and Design (OOAD), offering a visual representation of the system's functionality from the perspective of its users. They depict the various interactions between users and the system, outlining the different actions users can perform and the system's responses. In this section, we explore the significance of use case diagrams, their components, and their role in OOAD.
2.1 Significance of Use Case Diagrams:
Use case diagrams play a crucial role in OOAD by providing a high-level view of the system's behavior from an external perspective. They serve as a means of communication between stakeholders, developers, and designers, facilitating a common understanding of the system's requirements and functionalities. Use case diagrams enable stakeholders to visualize the system's scope, boundaries, and user interactions, ensuring that the system meets the needs of its users effectively.
2.2 Components of Use Case Diagrams:
a. Actors: Actors represent the different entities that interact with the system. They can be users, external systems, or other software components that interact with the system. Actors are depicted as stick figures outside the system boundary, representing their roles in initiating or participating in use cases.
b. Use Cases: Use cases represent the specific functionalities or features of the system from a user's perspective. Each use case describes a particular interaction between a user (actor) and the system to achieve a specific goal. Use cases are depicted as ovals within the system boundary, with the name of the use case written inside.
c. Relationships: Use case diagrams depict relationships between actors and use cases, indicating which actors are involved in each use case. These relationships help in understanding the roles of different actors and their interactions with the system to accomplish various tasks or goals.
2.3 Role of Use Case Diagrams in OOAD:
Use case diagrams serve as blueprints for the system's behavior, guiding the development process from requirements analysis to implementation. They help in eliciting, organizing, and prioritizing system requirements by focusing on user goals and tasks. Use case diagrams also aid in identifying potential system functionalities, defining system boundaries, and validating requirements with stakeholders. Furthermore, they provide a basis for test case generation, ensuring that the system's functionality aligns with user expectations and business objectives.
In summary, use case diagrams are indispensable tools in OOAD, providing a structured and visual representation of the system's functionality from a user's perspective. By depicting user interactions, goals, and system responses, use case diagrams facilitate communication, requirements analysis, and validation throughout the software development lifecycle. They play a vital role in ensuring that the final system meets the needs of its users and stakeholders effectively.
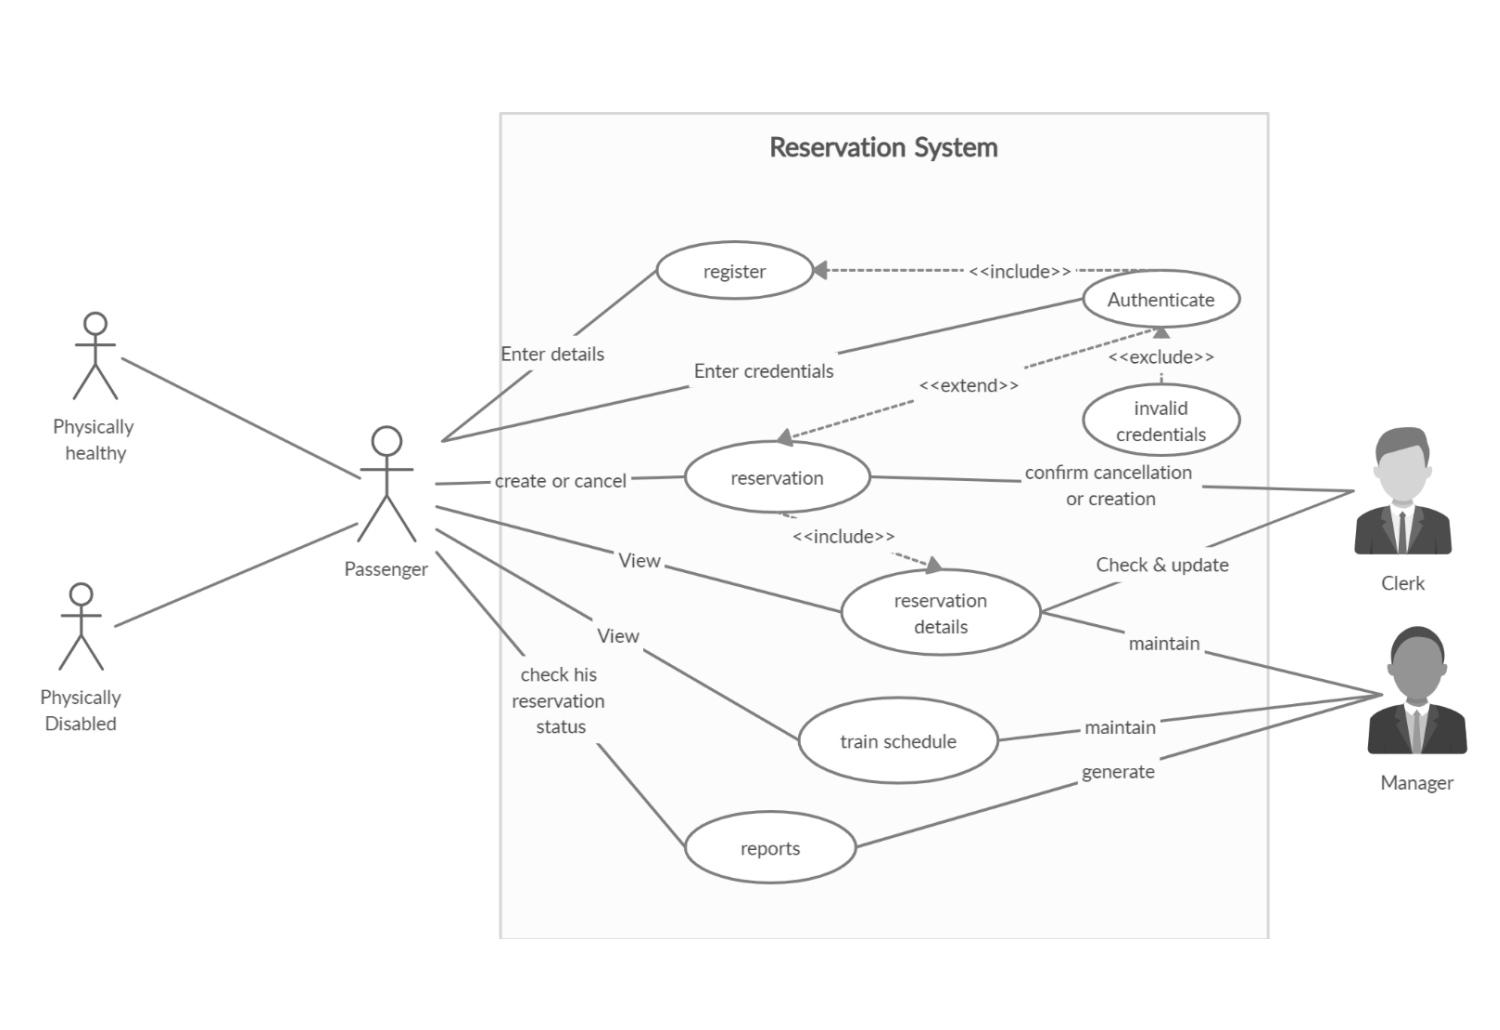
Actors:
● Passenger (Primary Actor): They can be further divided into two categories
● Physically abled
● Physically disabled
They have different privileges based on their physical condition.
● Clerk (Secondary Actor):
This person uses the system to create or cancel reservation tickets, view reservations status, and update reservation details.
● Manager (Secondary Actor):
This person uses this system to update train information and to generate reports.
Scenario:
● Passenger registers in the application.
● Passenger logins to access the system to view or to book or to cancel the reservations.
● The reservation clerk checks the details of the passenger.
● The reservation clerk checks whether the seats are remaining or not.
● If seats are not available, then he cancels the reservation and update the reservation details.
● If available, then he confirms the reservation and updates the reservation details.
● The passenger checks his reservation status.
● The manager updates the train information and generates the report with respect to reservation details.
Use Case diagram
3. Class diagram
3.1 Introduction
Class diagrams serve as a foundational element in Object-Oriented Analysis and Design (OOAD), providing a visual representation of the static structure of a system. They are indispensable tools for software engineers, architects, and stakeholders alike, offering a comprehensive overview of the system's entities, their attributes, relationships, and behaviors. In this section, we delve into the intricate details of class diagrams, exploring their significance, components, and the methodologies involved in their creation within the context of OOAD.
3.2 Significance of Class Diagrams:
Class diagrams play a pivotal role in OOAD, serving as blueprints for software systems. They encapsulate the essence of the system by defining the building blocks and their interconnections. Through class diagrams, stakeholders gain insights into the system's architecture, facilitating communication and collaboration among team members. Moreover, class diagrams serve as a basis for code generation, ensuring that the system's design aligns with its implementation.
3.3 Components of Class Diagrams:
a. Classes: At the core of every class diagram are classes, which represent the fundamental entities within the system. Each class encapsulates data (attributes) and behaviors (methods) relevant to its purpose. Classes are depicted using rectangles, with the class name positioned at the top, followed by its attributes and methods.
b. Attributes: Attributes denote the properties or characteristics of a class. They describe the state of objects belonging to a particular class. Attributes are represented as name:type pairs within the class rectangle.
c. Methods: Methods encapsulate the behaviors or operations that objects of a class can perform. They define the actions that can be invoked on objects to manipulate their state or interact with other objects. Methods are depicted beneath the attributes within the class rectangle.
d. Relationships: Class diagrams depict various types of relationships between classes, such as associations, aggregations, compositions, generalizations, and dependencies. These relationships elucidate the connections and interactions between different classes, contributing to a comprehensive understanding of the system's structure.
e. Multiplicity: Multiplicity specifies the cardinality of relationships between classes, indicating how many instances of one class are associated with instances of another class. It provides crucial information about the nature and constraints of associations between classes.
3.4 Methodologies for Creating Class Diagrams:
a. Requirements Analysis: Class diagrams are constructed based on the analysis of system requirements, user stories, and use cases. By identifying the entities, attributes, and behaviors relevant to the system's functionality, analysts lay the groundwork for class diagram creation.
b. Domain Modeling: Domain modeling involves mapping real-world concepts and relationships to classes and associations in the system. It helps in aligning the system's design with the problem domain, ensuring that the software solution accurately reflects the domain's intricacies.
c. Incremental Refinement: Class diagrams evolve iteratively throughout the software development lifecycle. They undergo refinement and enhancement based on feedback, changes in requirements, and emerging design considerations. Through incremental refinement, class diagrams evolve into robust representations of the system's architecture.
In summary, class diagrams serve as indispensable tools in OOAD, offering a systematic and structured approach to system modeling. By encapsulating the system's entities, attributes, relationships, and behaviors, class diagrams provide stakeholders with invaluable insights into the system's architecture and design. Through careful analysis, construction, and refinement, class diagrams pave the way for the development of robust and efficient software systems that meet the needs and expectations of stakeholders.
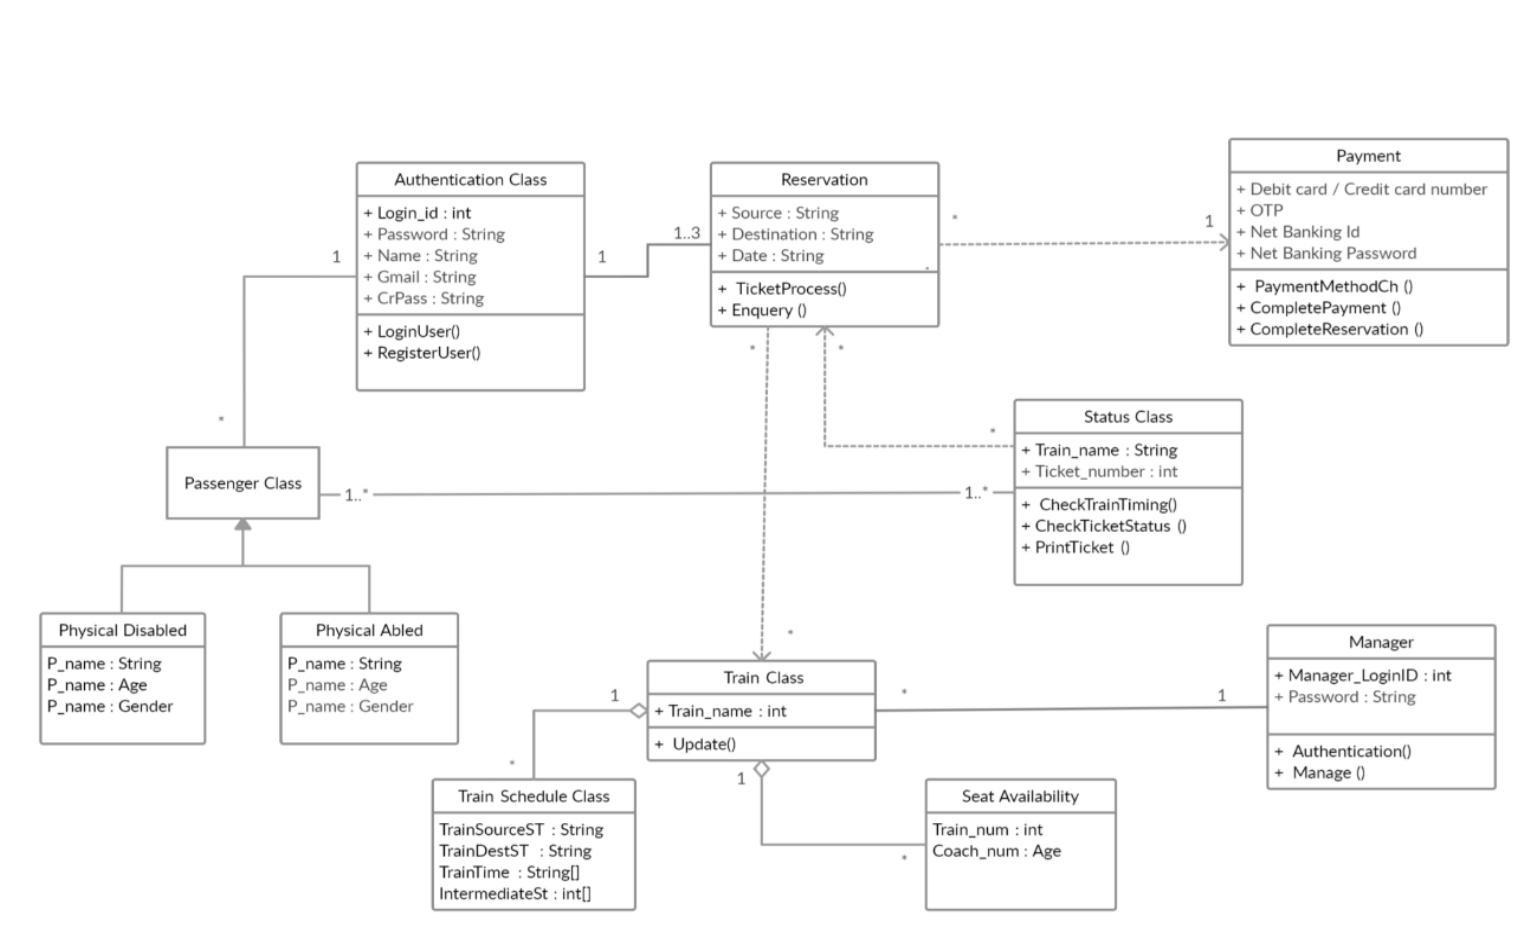
Fig:- Class Diagram
Our class diagram represents
1. Generalization between Passenger and Physical Disabled - physical Abled class. Passenger class is a super class (parent class) of 2 child classes.
2. Simple Association between :
I. Passenger and Authentication Class
II. Authentication and Reservation Class
III. Passenger and Status Class
3. Aggregation between Train class and Train Schedule – Seat Availability Class
4. We have 3 dependencies :
I. Reservation class depends on Train class
II. Reservation class depends on Payment Class
III. Status class depends on Reservation Class
5. Multiplicity used in every relation:
I. ‘*’ means many
II. ‘1’ means one
III. ‘1..3’ means less than equal to three and greater than equal to one
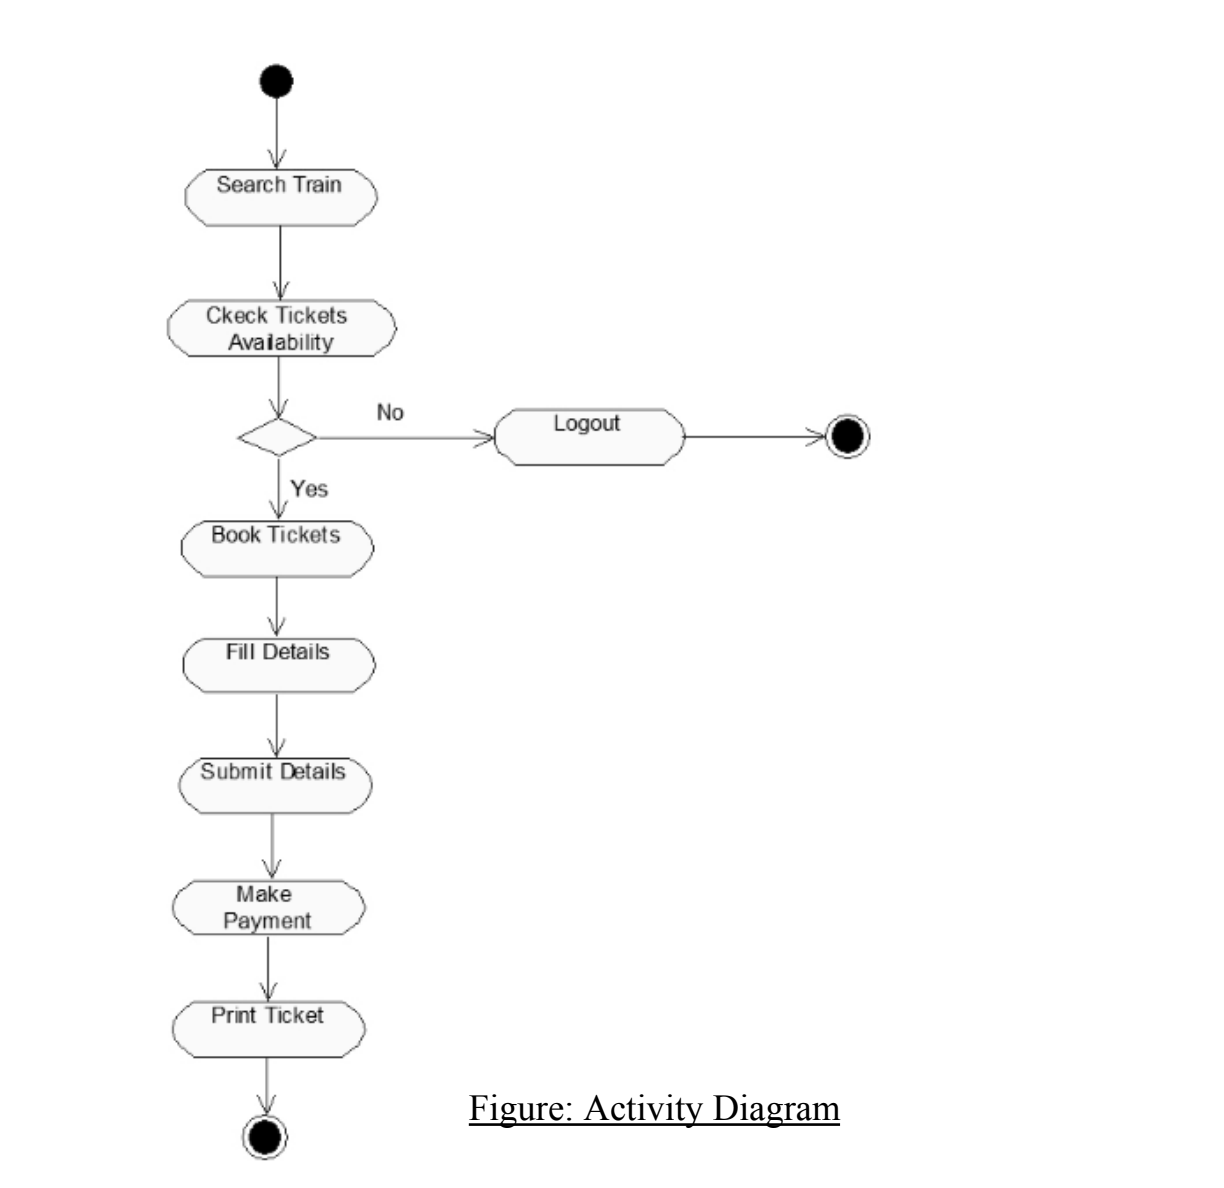
4. Activity diagram
4.1 Introduction
An activity diagram is a type of Unified Modeling Language (UML) flowchart that shows the flow from one activity to another in a system or process. It's used to describe the different dynamic aspects of a system and is referred to as a 'behavior diagram' because it describes what should happen in the modeled system.
Even very complex systems can be visualized by activity diagrams. As a result, activity diagrams are often used in business process modeling or to describe the steps of a use case diagram within organizations. They show the individual steps in an activity and the order in which they are presented. They can also show the flow of data between activities.
5. Sequence Diagram
Sequence diagrams are a type of UML diagram used to visually represent the interactions and flow of messages between objects or components within a system over time. They focus on depicting the chronological sequence of interactions between different entities in the system, typically illustrating the order of method calls, responses, and the flow of control during runtime.
In essence, sequence diagrams provide a dynamic view of the system's behavior, showing how objects collaborate to accomplish specific tasks or scenarios. They are particularly useful for understanding the communication patterns between objects, identifying potential bottlenecks, and ensuring that the system functions correctly under different conditions.
Key elements of a sequence diagram include lifelines, which represent the participating objects or components, and messages, which depict the communication between these objects. Messages can be synchronous, asynchronous, or self-referential, indicating the type and timing of the interaction between objects.
• These diagrams are used by software developers and business professionals to understand requirements for a new system or to document an existing process.
◦ Actor
◦ Lifeline
◦ Activations
◦ Call message
◦ Return message
◦ Self message
◦ Note etc.
Our sequence diagram consists of the following thing. It primarily describes the behavioral characteristics of the system.
I. 4 lifelines
II. 16 activations
III. Many call and return messages
IV. 1 self message
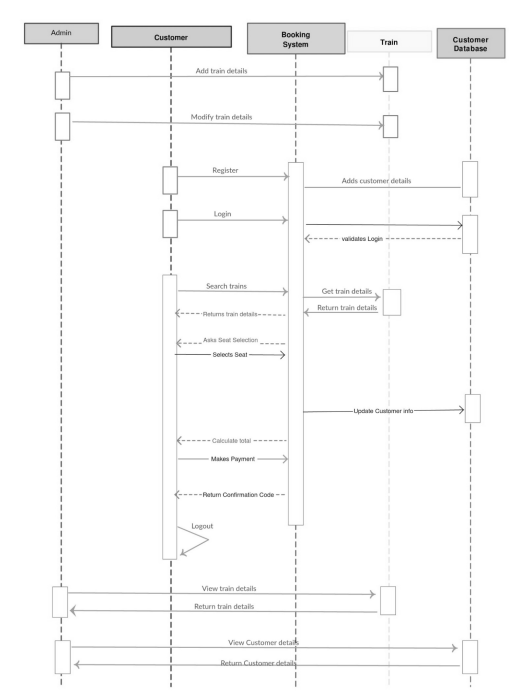
Fig:-SequenceDiagram
6. State Machine Diagram
A state machine diagram, also known as a state diagram, is a type of UML diagram that depicts the various states that an object or system can transition through in response to events during its lifecycle. It provides a graphical representation of the dynamic behavior of a system by illustrating the states, transitions, and events that drive the system's behavior.
In a state machine diagram, states represent the different conditions or modes that an object or system can be in at any given time. Transitions define the movement between states, triggered by events or conditions. Events are external stimuli or triggers that cause a transition from one state to another.
State machine diagrams are particularly useful for modeling complex behaviors, such as the lifecycle of an object, the workflow of a process, or the behavior of a software system. They help in understanding the various states that an entity can exist in, the events that drive transitions between states, and the conditions that govern these transitions.
Overall, state machine diagrams provide a clear and visual representation of the dynamic behavior of a system, aiding in requirements analysis, system design, and validation. They are valuable tools for developers, architects, and stakeholders to comprehend and communicate the intricate behavior of a system effectively.
Our State Machine Diagram contains :
● Our state machine diagram below describes the behavior of various states with an Online Railway Reservation System.
● We have :
I. Each and every required state with transition
II. Entry-Exit actions etc.
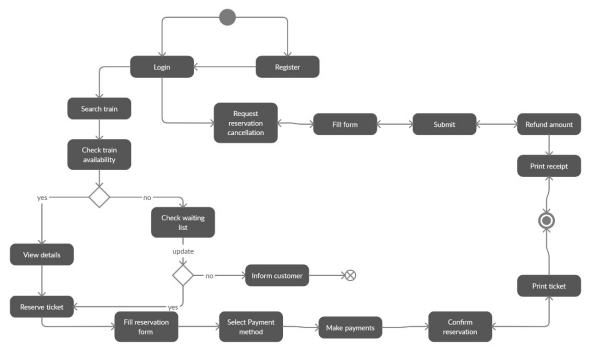
Fig:- State Machine Diagram
Conclusion
In conclusion, the railway reservation system's Object-Oriented Analysis and Design (OOAD) report presents a systematic and detailed representation of the system's architecture, functionalities, and interactions. Through the utilization of various UML diagrams including class diagrams, use case diagrams, interaction diagrams, state machine diagrams, and activity diagrams, the essential aspects of the system have been effectively captured and illustrated.
Te class diagrams serve as a foundational element, delineating the static structure of the system. Entities such as Train, Passenger, Ticket, Reservation, Schedule, Payment, and Station, along with their attributes, relationships, and behaviors, are depicted comprehensively. These diagrams facilitate a clear understanding of the system's data model and the relationships between different entities.
Use case diagrams offer a holistic view of the system's functionalities from the users' perspective. They outline the various actions that users can perform and illustrate the interactions between users and the system. By defining user requirements and system boundaries, these diagrams ensure alignment with stakeholders' needs and expectations.
Activity diagrams provide a visual representation of the dynamic behavior within the system, depicting the flow of activities and actions across different processes or scenarios. These diagrams aid in understanding the sequence of operations and decision points, thereby optimizing processes and enhancing workflow management.
State machine diagrams capture the dynamic behavior of individual entities within the system. They illustrate the states, transitions, and events, enabling a deeper comprehension of the system's behavior over time. By modeling state transitions and interactions, these diagrams facilitate system design, analysis, and validation.
Overall, the railway reservation system's OOAD report adopts a comprehensive and structured approach to system modeling. By leveraging UML notation and diagrams, stakeholders can gain valuable insights into the system's requirements, design, and implementation. This lays the groundwork for the development of a robust and efficient railway reservation system that meets the needs of both passengers